

Electric vehicles (EVs) have been around for decades but have only recently made up a significant chunk of car purchases worldwide. In the U.S. over the past decade, the number of EVs on the road have gone from almost zero in 2011 to around 1,200,000 in 2019.[1] With this surge in purchases (largely due to the popular Tesla models now available) comes questions around their true environmental impact. So what is the environmental impact of electric vehicles compared to a gas-powered vehicle? If you plug it in to charge, doesn’t it use the same energy as everything else? If so, are electric cars bad for the environment?
In this article we’ll give YOU the tools to make the right decision for your area.
Why Focus on Vehicles?
It may be obvious to some, but the transportation sector is responsible for one of the largest chunks of carbon emissions. In fact, transportation is responsible for about 30% of greenhouse gas emissions worldwide![2] In the U.S. alone, the transportation sector emits around 19 million metric tons of CO2 Equivalent (MTCO2e). This equates to around 28% of our annual total![3] This is why there is such a focus on reducing emissions from the transportation sector.
Theoretically, if we are able to reduce or eliminate the emissions from the transportation sector, we could see huge reductions in overall emissions. In such a car-dependent culture, this would no doubt be an easier and quicker transition than pushing for overall reductions in car ownership due to the many reasons people may rely on a personal vehicle. While that would be an excellent or ideal solution, it’s simply not feasible for many folks outside of major metropolitan areas with extensive infrastructure.
Environmental Impact of Electric Vehicles vs the Internal Combustion Engine
Let’s examine the life cycle of both types of vehicles to determine the environmental impact of electric vehicles compared to gas-powered vehicles (GPVs).
Mining and Manufacturing Phase
The first thing to consider is the environmental impacts of the mining and production of all materials.The ‘pre-manufacture’ and ‘product manufacture’ stages are where electric vehicles have around 44% greater impact on the environment than GPVs.[4] [5] This is primarily due to the materials needed to make the Lead Acid batteries currently used in EVs. More efficient batteries are in development which is encouraging, however they could take some time to be manufactured.
While we know that Electric Vehicles generally take more energy to produce, we cannot specify exactly what the total emissions are for the production of an Electric Vehicle OR a standard vehicle. The current research focuses primarily on whole-life cycle analysis rather than breaking these stages down. Also, there are so many vehicle models on the market that it is difficult to determine the environmental cost of each one.
We do know that the vast majority of emissions come from the operating stage of a vehicle’s life. That will be our focus today.
Operating or Driving Phase
Where EVs can have a significant advantage over internal combustion vehicles is in the operation of the vehicle. Electric vehicles need fewer repairs than traditional vehicles over their lifetime. Also, electricity often has a lower environmental impact (greenhouse gas emissions) than gasoline or diesel fuel.
So how do we know if the power grid gives us cleaner energy than gasoline?
To determine if electricity is a cleaner fuel than gasoline, we look at the location where the vehicle will operate. This is because each region around the world has a different energy ‘grid mix’ (percentage of various energy sources that make up an area’s electricity). It varies wildly from country to country, state to state, and even city to city.
Therefore, driving an electric vehicle has fewer emissions or negative environmental impacts in Vermont and greater emissions in Florida. No two states have the same rate of CO2e emissions each year. This is a result of the variety of energy sources available or utilized in each region.
For an example of how varied these grid mixes can be, let’s take a look at a quick case study between California and Missouri. We’ll also give YOU the tools to do the math for your area.
For quick reference, kilowatt hours, or kWh, is a measurement of energy use for electricity. To compare this to the standard vehicle, we’ll have to compare the environmental impacts of the electricity generated in the area for the EV vs gasoline.
In the state of California as of 2018, its energy mix was the following[6]:
- Natural Gas 45.9%
- Solar 13.8%
- Hydro 13.4%
- Nuclear 9.3%
- Wind 7.2%
- Geothermal 6.0%
- Biomass 3.1%
- Other 1%
- Coal .1%
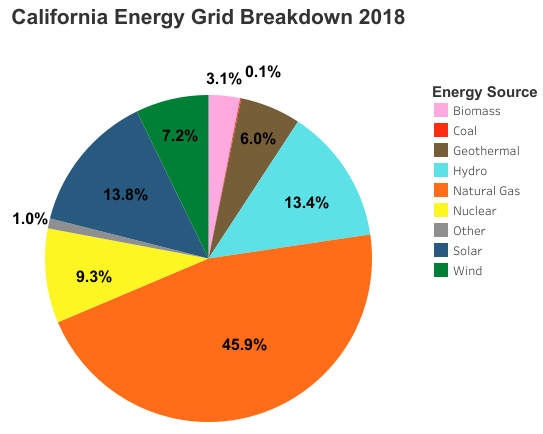
Every time a light is switched on in the state of California, these are theoretically the sources of that energy. I say ‘theoretically’ because this is generalized to the whole state. Typically, the energy grid mix will vary based on more specific regions serviced by different companies. All these energy sources and how much CO2e they emit gives it a certain emission rate for the state. In California’s case, the grid mix translates into a total output of .422 lbs of CO2e per kilowatt-hour of energy generation.
In comparison, Missouri is MUCH different as you’d probably guess. Here’s what their grid mix looked like in 2018, see if you can spot the differences:
In the state of Missouri as of 2018, its energy mix was the following:
- Coal 73.4%
- Nuclear 13.1%
- Natural Gas 8.5%
- Wind 3.5%
- Hydro 1.1%
- Biomass .2%
- Oil .1%
- Solar .1%
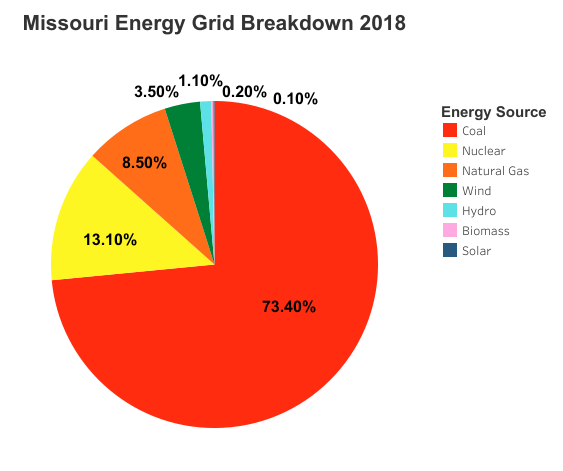
When we take this grid mix into account, we get a total output of 1.713 lbs of CO2e per kilowatt-hour of energy generation which is over 4 times greater than California.
So What Does This Mean?
Let’s put these numbers to work to illustrate our point. For the following calculations, we’ll use the numbers we just established for California and Missouri.
You can easily do this for your state too! To find out how environmentally friendly the electric vehicle is in your area, you’ll need two things: your state or region’s emission rate and how many kilowatt hours would be used for that vehicle annually based on how many miles it will be driven. The state rates can be found on the eGRID website, link is in the sources below. If you know how many miles you drive each year, use that! For our purposes, we will use national averages.
To make things easier, here’s a map that will give you a general idea of the environmental impact of electric vehicles in your state compared to a gas-powered vehicle. The more green a state is, the better an Electric Vehicle is for the environment in that area:
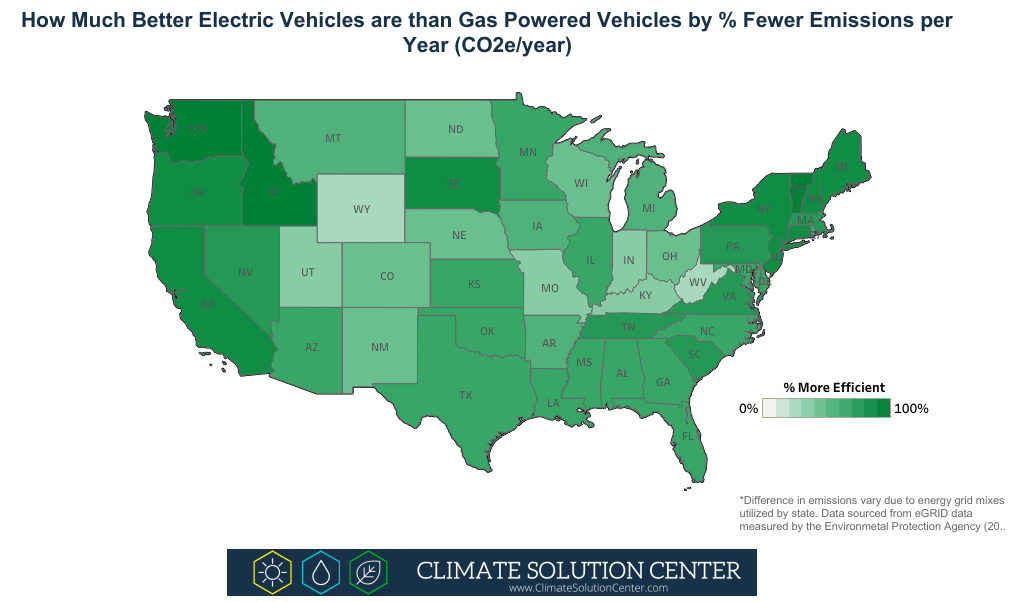
If you would like to see exactly what the percentage is for each state, you can visit our public Tableau Dashboard here.
Warning: Math Ahead!
According to a recent study, the average passenger vehicle in the U.S. travels about 10,000 miles annually.[7] We also have data from the Alternative Fuels Data Center under the U.S. Department of Energy that estimates older electric vehicles use, on average, .5 kWh per mile traveled. Newer models are about 3 times more efficient and travel around 6 miles per kWh or .1667 kWh per mile traveled. For our purposes here, let’s take an average of those two numbers and say the average electric vehicle travels 3 miles per kWh of charge. Therefore, we can say that the average electric vehicle in the U.S. will use about 3,333 kWh each year (.33 x 10,000 = 3,333.33) in electricity.
If we know that 3,333 kWh are needed annually per vehicle, then we simply multiply that by the emission rate for your state. The kWh will stay the same, but the pounds of CO2e emitted will change. To continue with our examples of California and Missouri, that would be:
California: 3,333 kWh x .422 lbs of CO2e = 1,406.53 lbs of CO2e per year for an average EV
Missouri: 3,300 kWh x 1.713 lbs of CO2e = 5,652.9 lbs of CO2e per year for an average EV
This is a HUGE difference! Of course, this is a rough estimate and efficiencies will vary based on which specific EV you use. However, this should give you an idea of how different regions can be. So, are EVs better for the environment or not?
Let’s compare these figures to the average gas-powered vehicle. Don’t worry, this will be quick:
The average Miles Per Gallon (MPG) for light duty vehicles in the U.S. (cars, SUVs, trucks, etc.) as of 2017 was 22.3 MPG.[8] Each gallon of gasoline emits 19.36 lbs of CO2e[9], so we can divide 19.36 lbs of CO2e per gallon by 22.3 miles which equals .868 lbs of CO2e per MILE (19.36 / 22.3 = .868).
Thus, if we multiply .868 lbs of CO2e by 10,000 miles traveled, we get 8,680 lbs of CO2e emitted each year by the average light duty vehicle in the U.S (.868 x 10,000 = 8,680).
If we want a per-mile comparison, we could say .33 kWh x .422 lbs of CO2e = .14 lbs of CO2e per mile in California or .33 kWh x 1.713 lbs of CO2e = .57 lbs of CO2e per mile in Missouri.
As you can see, the environmental impacts of electric vehicles will vary by region. However, even in the worst U.S. state for emissions from electricity (Wyoming), 2.06 lbs of CO2e are emitted per kWh. EVEN THEN it’s better than burning gasoline. In the worst-case scenario here the emissions from a kWh are .68 per mile from the grid while gasoline is still worse at .868 lbs of CO2e per mile. That’s still 22% fewer emissions emitted per mile compared to gasoline!
Are Electric Vehicles Better for the Environment?
That’s a resounding YES! Despite the variables in local power grids which impacts just how positive electric vehicles are for the environment, EVs are always better per mile than gasoline. As their tech continues to improve and the manufacturing process becomes more sustainable, EVs will get even better.
With more states moving toward electrifying the grid via renewable technologies, the case for an EV will become even stronger. We need to continue adding cleaner energy sources if we want to make a difference in our emissions from the transportation sector. Electric Vehicles will ultimately play a critical role in our transition away from fossil fuels.
Want to see more articles like this one delivered directly to your inbox each week? Sign up for our newsletter and join our movement!
Sources:
[1] “Electric Vehicle Sales: Facts & Figures” Edison Electric Institute, April 2019.
[2] Pouria Ahmadi, “Environmental impacts and behavioral drivers of deep decarbonization for transportation through electric vehicles” Journal of Cleaner Production, vol. 225, pp 1209-1219, July 10th, 2019.
[3] “Sources of Greenhouse Gas Emissions”. Environmental Protection Agency, 2018.
[4] Katja Gradin, Sofia Poulikidou, Anna Bjorklund, and Conrad Luttropp. “Scrutinising the electric vehicle material backpack”. Journal of Cleaner Production, Vol. 172, pp. 1699-1710, 2018.
[5] Troy Hawkins, Bhawna Singh, Guillaume Majeau-Bettez, Anders Hammer Stromman, “Comparative Environmental Life Cycle Assessment of Conventional and Electric Vehicles”. Journal of Industrial Ecology, vol. 17, pp. 53-64, 2013.
[6] “eGRID Summary Tables 2018” Environmental Protection Agency, March 9th, 2020.
[7] Pouria Ahmadi, “Environmental impacts and behavioral drivers of deep decarbonization for transportation through electric vehicles”.
[8] “Annual Vehicle Distance Traveled in Miles and Related Data – 2017” Federal Highway Administration, March 2019.
[9] “Emission Factors for Greenhouse Gas Inventories” United States Environmental Protection Agency, March 9th, 2018.

Leave a Reply